StatCI — Confidence Interval Visualizer
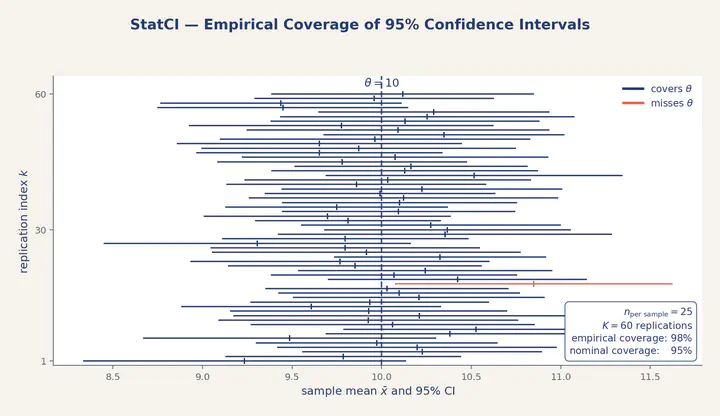 Many independent samples are drawn from the same population; each yields a $95%$ confidence interval. Intervals that cover the true parameter $\theta$ are drawn in navy, those that miss in coral. Coverage approaches the nominal $1-\alpha$ as the number of replications grows.
A browser-only simulation tool for the single most misunderstood object in introductory statistics: the confidence interval. StatCI turns the frequentist definition into a visible, repeatable experiment, so that a student can see the long-run coverage statement instead of only reading it.
The misconception StatCI addresses
Surveys of statistics students consistently report the same wrong reading of “95% confidence”: the belief that a particular computed interval $[\hat\theta_{L},\hat\theta_{U}]$ contains the true parameter $\theta$ with probability $0.95$. The frequentist statement is in fact about the procedure, not about any single interval: across many independent samples from the same population, the proportion of CIs that cover $\theta$ converges to the nominal level $1-\alpha$. StatCI turns this abstract sentence into an animation.
What the app does
The user picks (i) a sampling distribution and the true parameter value $\theta$, (ii) a sample size $n$, (iii) a confidence level $1-\alpha$, and (iv) the type of interval (e.g., $z$- or $t$-interval for a mean, exact / Wilson / Wald interval for a proportion, $\chi^{2}$ interval for a variance). The app then:
- draws $K$ independent samples from the chosen population;
- computes the corresponding $K$ confidence intervals;
- stacks them on a single horizontal axis, with the true parameter $\theta$ marked by a vertical reference line;
- colours each interval according to whether it covers $\theta$ (navy) or misses it (coral);
- reports the running empirical coverage $\hat{C}_K$ and compares it to the nominal $1-\alpha$.
The simulation can be advanced one sample at a time, or in batches of $50$/$500$/$5000$, so students can watch the empirical coverage stabilise at the nominal level as $K$ grows.
Pedagogical use
StatCI is designed for the lecture in which the definition of a confidence interval is introduced, and for the practical that follows. Three exercises map naturally to the app:
- Coverage at the nominal level. Verify that for a $z$-interval on a normal mean, $\hat{C}_K \to 0.95$ as $K \to \infty$.
- The cost of model misspecification. Build a Wald interval for a binomial proportion close to $0$ or $1$ and observe that the empirical coverage falls well below $0.95$ — motivating the Wilson and Clopper–Pearson alternatives.
- The effect of $n$ and $\alpha$. Show that doubling $n$ halves the interval width while leaving coverage unchanged, and that lowering $\alpha$ raises coverage at the cost of width.
Technical notes
The app is a single-page client-side application built with React + Vite: all sampling and inference run in the student’s browser, with no server round-trip and no data leaving the device. Random samples are produced from a high-quality PRNG seeded by the user (so that classroom demonstrations are reproducible across machines). Quantiles for the $z$, $t$, $\chi^{2}$, and $F$ distributions are computed with the jStat numerical library (MIT-licensed). The static bundle is deployed on Netlify; like its siblings, it works offline after first load and has no external run-time dependencies.