StatTables — Interactive Statistical Distribution Tables & Calculators
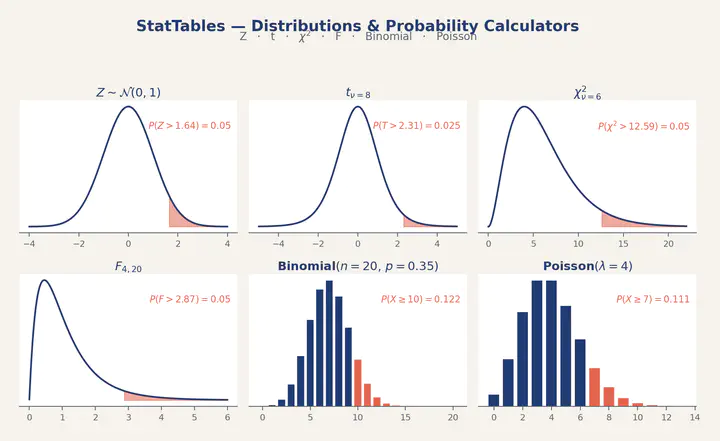 Coordinated view: the classical book-style table, the shaded density plot, and the step-by-step formula breakdown for the same query.
An interactive web application that replaces the printed statistical tables traditionally found at the back of introductory statistics textbooks. The app is designed for undergraduate courses in statistical inference, probability, and applied statistics at Qatar University, and is freely available to students and instructors elsewhere.
Why not the printed tables?
Classical textbook tables are fixed to a handful of significance levels (typically $\alpha \in {0.10, 0.05, 0.025, 0.01, 0.005}$) and to a limited grid of degrees of freedom or parameter values. In practice, students need critical values and tail probabilities at arbitrary points — and instructors want them reproducible, shareable, and visually annotated. StatTables returns exact values for any query, simultaneously displays the corresponding shaded region on the density curve, and shows the formula being applied — so the numerical answer is always paired with both geometric intuition and analytical rigor.
Distributions covered
Continuous:
- Standard normal $Z \sim \mathcal{N}(0,1)$ — critical values $z_{\alpha}$, two-sided cutoffs $z_{\alpha/2}$, and tail probabilities $P(Z > z)$.
- Student $t$ — $t_{\alpha,\nu}$ for any degrees of freedom $\nu$; $t$-tests and confidence intervals for the mean under unknown variance.
- Chi-square $\chi^{2}$ — lower and upper critical values $\chi^{2}_{\alpha,\nu}$ for variance tests, goodness-of-fit, and tests of independence.
- Fisher $F$ — $F_{\alpha, \nu_{1}, \nu_{2}}$ for analysis of variance, regression overall-significance tests, and variance-ratio comparisons.
- Exponential — survival, hazard, and waiting-time problems.
Discrete:
- Binomial $X \sim \mathcal{B}(n,p)$ — pmf, cdf, and tail probabilities for finite Bernoulli experiments.
- Poisson $X \sim \mathcal{P}(\lambda)$ — counts of rare events over fixed exposure.
How students use it
For every distribution the app supports both directions:
- Cutoff $\rightarrow$ probability. Given a value of the test statistic, obtain the one- or two-tailed $p$-value.
- Probability $\rightarrow$ cutoff. Given a significance level $\alpha$, obtain the corresponding critical value.
Each query is rendered in three coordinated panels:
- a classical book-style lookup table, with the cell matching the current query highlighted;
- a shaded density plot indicating the region the reported probability refers to, removing the ambiguity that often surrounds one- vs. two-tailed procedures;
- a step-by-step formula breakdown, so the student can see the integral or summation being evaluated.
Classroom workflow
The app is intended as an in-class replacement for the printed appendix tables. During exercises, students paste the query parameters they used into their solution; during exams the app’s screen can be mirrored on the instructor’s display so the class works from a shared source of truth. The accompanying solution sheets indicate the exact query, not a table row, making grading deterministic and self-checkable.
Technical notes
The app is a single-page client-side application built with React + Vite and styled with Tailwind CSS: all computation runs in the student’s browser, with no server round-trip. Quantiles, cdf, and pmf values are computed with the jStat numerical library (MIT-licensed). Density curves are rendered on an HTML canvas so that shaded regions and critical-value markers stay crisp on high-DPI displays. The bundle is fully static and is deployed on Netlify, which means it works offline after first load and has no external dependencies at run time.