Dhafer Malouche
- Bayesian networks & graphical models
- Biomedical & public-health statistics
- Chronic-pain & oncology modeling
- Survey methodology & data quality
- Reproducible data science (R · Python)
- Interactive dashboards & Shiny apps
Dhafer Malouche
Welcome to My Academic Hub
Welcome to my professional website! As a Professor of Statistics at Qatar University with over 25 years of experience across international institutions, I’ve created this space to share my academic journey and resources with students, colleagues, and fellow researchers.
What You’ll Find Here
- Interactive Tutorials: Step-by-step guides on statistical methods, data science techniques, and programming with R, Python, H2O, and Spark
- Research Portfolio: Access to my published papers, ongoing projects, and collaborations spanning Bayesian networks and graphical models; public health, epidemiology, and Qatar Biobank research; hematology and oncology (NASH, T-cell leukemia, pancreatic cancer); chronic pain and neurological disorders (multiple sclerosis); actuarial statistics and stochastic processes; engineering education and educational technology; systematic reviews and meta-analyses; sensory and consumer data analysis; survey methodology and data quality; and AI regulation, anticipatory law, and finance
- Teaching Materials: Course resources, lecture notes, and educational tools for statistics, stochastic processes, and actuarial science
- Interactive Applications: Explore data through custom Shiny apps, dashboards, and visualization tools I’ve developed for research and education
- Data Analysis Projects: Case studies demonstrating statistical modeling, machine learning, and data visualization techniques
- Professional Background: Details about my academic journey, including my work at universities in Qatar, Egypt, Tunisia, and my international appointments as a Fulbright Scholar (Stanford University and University of Michigan) and Visiting Scholar (Yale University and York University)
My expertise spans statistical theory and practical applications using modern computational tools. Whether you’re interested in graphical models, public health analytics, hematology, chronic pain modeling, sensory data analysis, or AI regulation, you’ll find relevant content throughout this site.
Feel free to contact me with questions, collaboration ideas, or feedback on any of the resources shared here.
ORCID ID

Biography
Dr. Dhafer Malouche is a Professor of Statistics at Qatar University, with more than 25 years of academic experience across Europe, North Africa, the Middle East, and North America. He earned his Ph.D. in Statistics and Applied Mathematics from Paul Sabatier University and has held faculty positions in Tunisia, Egypt, and Qatar.
His international experience includes appointments as a Fulbright Scholar at Stanford University (2011) and the University of Michigan (2016–2017), as well as long-term research collaborations with Yale University through the MacMillan Center (2014–2019). His work during these periods addressed survey methodology, data quality, governance, and applied statistical modeling in social and health sciences.
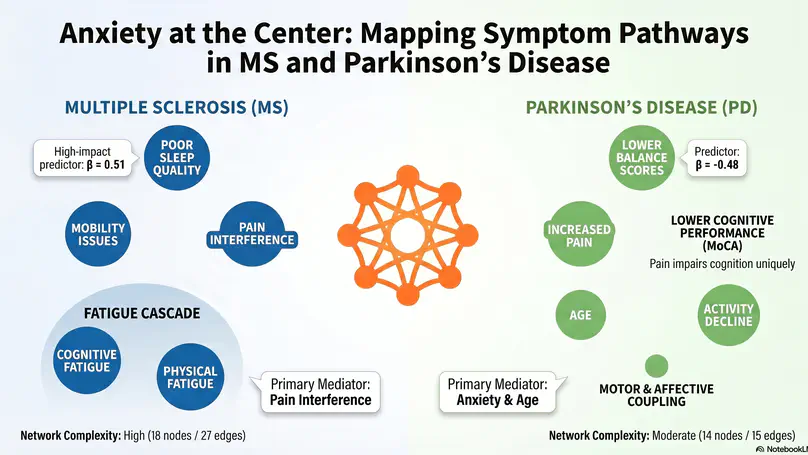
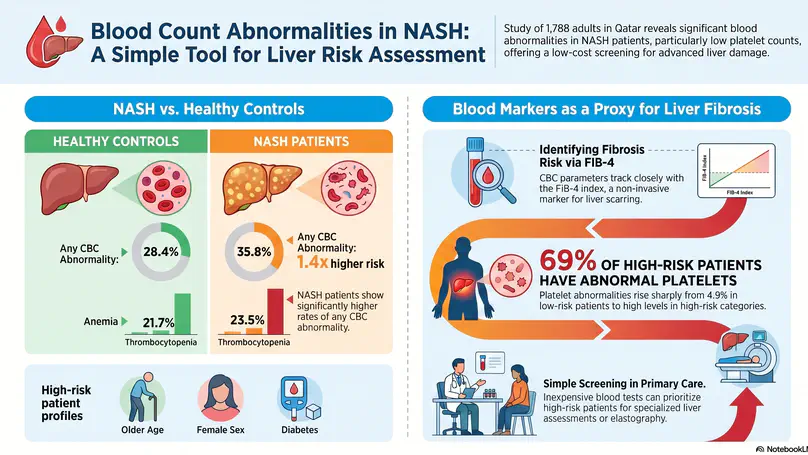
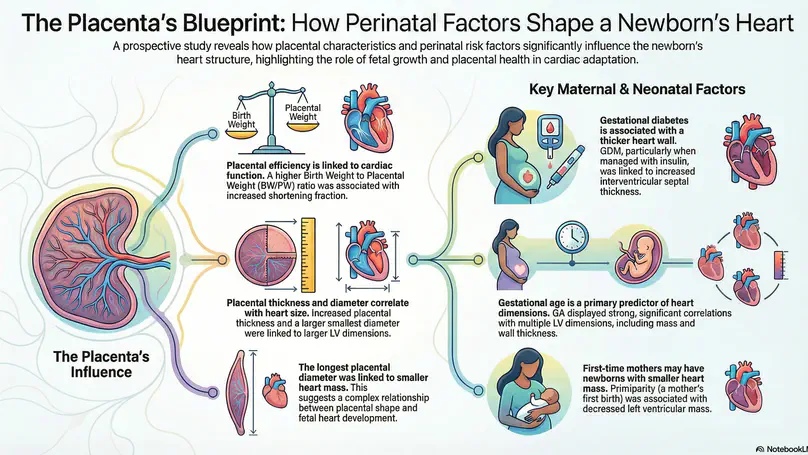
Dr. Malouche’s research spans a broad range of statistical and interdisciplinary domains. In biomedical and public health research, he works extensively with Qatar Biobank data, leading and co-authoring studies on chronic pain, cardiometabolic risk, autoimmune diseases, hematological abnormalities, and gender disparities in quality of life. His clinical collaborations extend to oncology (pancreatic cancer, T-cell leukemia), neurological disorders (multiple sclerosis), and systematic reviews of clinical outcomes. His methodological contributions focus on Bayesian networks, graphical models, epidemiological modeling, and reproducible data science workflows. Beyond biomedical research, he collaborates on engineering education and educational technology, examining the impact of virtual reality and blended learning on student engagement. He is also engaged in interdisciplinary work at the intersection of statistics, AI regulation, anticipatory law, and finance, applying quantitative foresight methods to emerging legal and economic challenges. His recent work further examines the reliability of AI-detection tools in scientific publishing.
In teaching, Dr. Malouche delivers advanced courses at both undergraduate and doctoral levels, including stochastic processes, actuarial statistics, and advanced biostatistics for PhD students in the biological sciences. He makes extensive use of R, Bayesian methods, and real-world health data, and regularly develops reproducible teaching materials, Shiny applications, and LaTeX-based resources to support applied statistical training.
Beyond academia, Dr. Malouche has served as a statistical consultant for international organizations, including the World Health Organization, contributing to analyses of COVID-19 impacts on mental health and health systems. At Qatar University, he continues to lead interdisciplinary research, supervise graduate students, and contribute to methodological innovation at the intersection of statistics, public health, and data science.
Download my resumé.
- Bayesian Networks & Graphical Models
- Public Health & Qatar Biobank Research
- Hematology, Oncology & Clinical Research
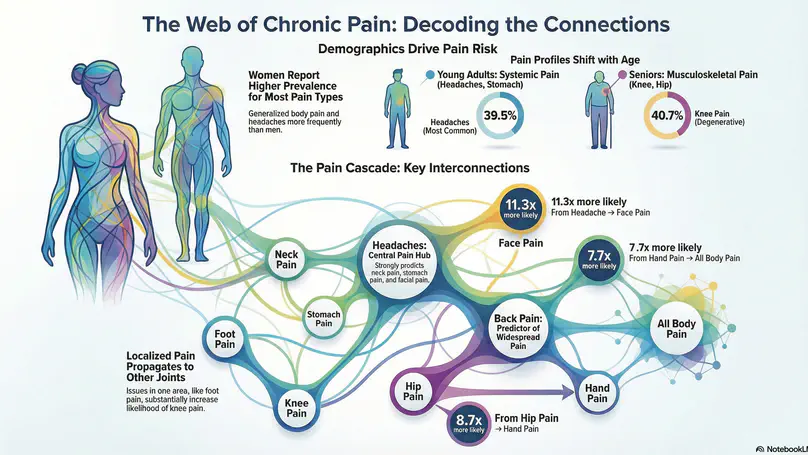
- Chronic Pain & Neurological Disorders
- Actuarial & Stochastic Processes
- Survey Methodology & Data Quality
- AI Regulation, Anticipatory Law & Finance
- Sensory & Consumer Data Analysis
- Engineering Education & Educational Technology
- Systematic Reviews & Meta-Analyses
- Epidemiology & Infectious Diseases
-
Habilitation (Tenure), Problèmes autour de la probabilité et de la statistique, Méthodes et Applications., September 2009
Université de Tunis ElManar Ecole National d'Ingénieurs de Tunis, Tunisia.
-
Ph.D. in Statistics and Probability, October 1997
Paul Sabatier University, Toulouse, France
-
Master in Applied Mathematics, 1993 - 1994
Paul Sabatier University, Toulouse, France
-
Bachelor (Maîtrise) in Mathematics, 1989 – 1993
Ecole Normale Supérieure de Bizerte, Tunisia
Recent Publications
Preprints
Probabilistic pathways from chronic pain to suicidal ideation in Qatar: a Bayesian-network study
Authors: Aisha Al Khinji, Dhafer Malouche
Status: Under Review — Journal of Translational Medicine
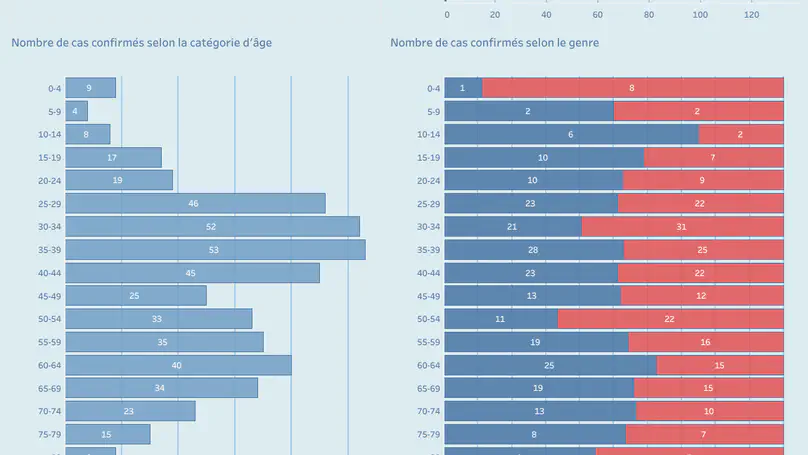
Abstract: Chronic pain frequently co-occurs with depressive and anxiety symptoms and doubles or triples the risk of suicidal ideation. Yet the joint pathways linking these conditions remain under-explored in Middle-Eastern settings. We analyzed questionnaire data from 2,363 Qatari adults enrolled in the Qatar Biobank using a data-driven Bayesian Network to map probabilistic interdependencies between chronic pain, mental-health symptoms and demographic factors, with a focus on sequences culminating in suicidal thoughts. The final BN identified self-regret and psychomotor change as the strongest direct predictors of suicidal thoughts, with an early-symptom cascade (sleep problems → anhedonia → depression) amplifying suicide risk. Fatigue linked chronic pain to self-regret, illustrating a physical–psychological bridge.
Comparative Cardiovascular Risk Index Across Autoimmune Conditions in a Large Middle-East Health System
Authors: Aisha Al Khinji, Dhafer Malouche, Abdullatif Al-Hor, Hadeel Ashwal, et al.
Status: Posted
Abstract: Autoimmune diseases confer excess cardiovascular disease (CVD) risk, yet comparative profiles across phenotypes in Gulf health systems are unclear. Using routinely collected primary-care records, we analyzed 14,616 adults and derived a composite CVD risk index from a Framingham-based algorithm. Relative to the non-autoimmune reference, adjusted odds of high risk were higher in rheumatoid arthritis (OR 1.20, 95% CI 1.06–1.37), lower in Hashimoto’s thyroiditis (0.49, 0.40–0.60), and not clearly different in SLE or multiple-autoimmune phenotypes. These findings support systematic CVD risk assessment and targeted management in autoimmune populations within Gulf health systems.
arXiv
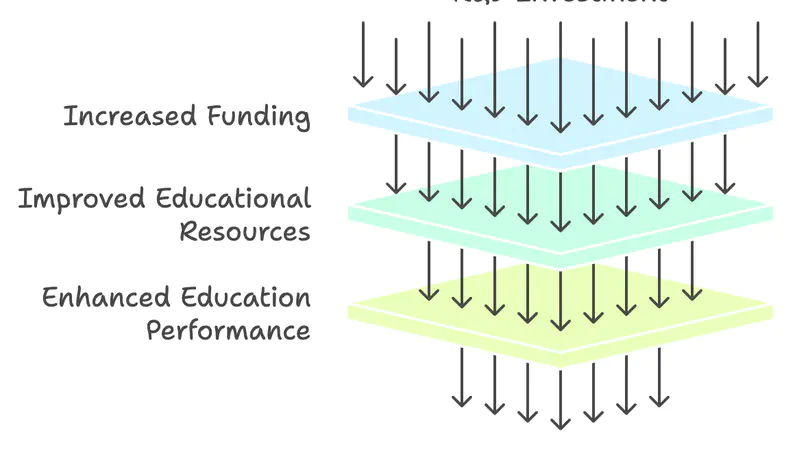
More investment in Research and Development for better Education in the future?
Authors: Rim Lahmandi-Ayed, Dhafer Malouche
Year: 2018 — arXiv:1807.08458 [stat.AP]
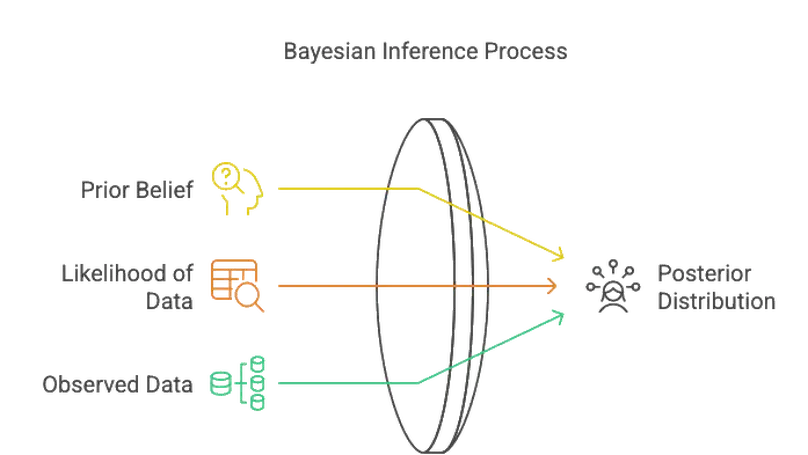
Abstract: This paper tests whether national R&D investment causally affects schoolchildren’s education performance. OECD PISA scores are merged with the World Bank’s World Development Indicators and Bayesian-network learning is applied to identify a statistical causal relationship between a country’s R&D expenditure and its PISA performance. The effect is long-term: at least about ten years of sustained R&D investment is required before improvements in pupil performance become detectable.
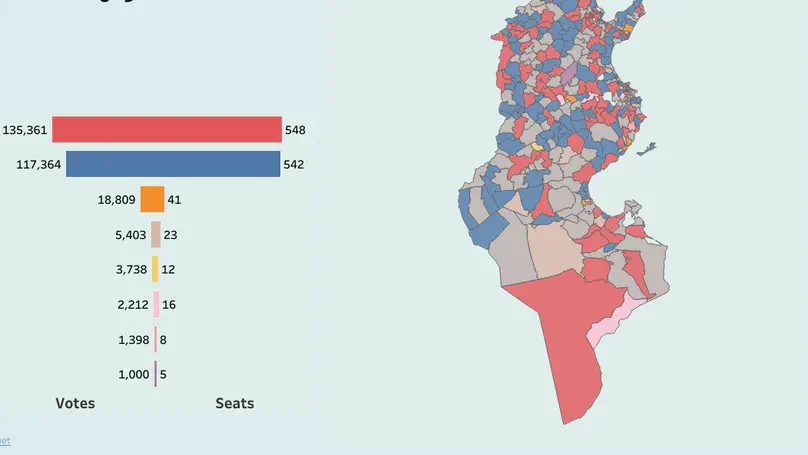
Wage gap between men and women in Tunisia
Authors: Hela Jeddi, Dhafer Malouche
Year: 2015 — arXiv:1511.02229 [stat.AP]
Abstract: Wage differentials between males and females in Tunisia are estimated using the Oaxaca–Blinder decomposition applied to the Tunisian Population and Employment Survey (2005). The estimated gender wage gap is approximately 19%, attributable primarily to discrimination (underestimation of female characteristics in the labour market) rather than differences in observable characteristics.
Duality in Graphical Models
Authors: Dhafer Malouche, Bala Rajaratnam, Benjamin T. Rolfs
Year: 2013 — arXiv:1310.2641 [math.ST]
Abstract: This work examines the formal duality between undirected (concentration) and bidirected (covariance) Gaussian graphical models. Pairwise and global Markov properties are developed under weaker pseudographoid and reverse-pseudographoid rules (in lieu of intersection/composition), and the duality is then used to transport results across the two model classes, including new results on faithfulness implications.
Gaussian Covariance Faithful Markov Trees
Authors: Dhafer Malouche, Bala Rajaratnam
Year: 2009 — arXiv:0912.2407 [math.PR]
Status: Published as Journal of Probability and Statistics (2011), Article ID 152942.
Abstract: This paper studies covariance graphs (undirected graphs encoding marginal independencies) for multivariate Gaussian distributions, focusing on the case in which the covariance graph is a tree. New conditions are derived under which the covariance graph faithfully represents the marginal-independence structure of a Gaussian random vector.
arXiv:0912.2407 — Published version (DOI)
Determining full conditional independence by low-order conditioning
Authors: Dhafer Malouche
Year: 2007 — arXiv:0705.1613 [math.ST]
Status: Published in Bernoulli 15(4), 1179–1189 (2009).
Abstract: The concentration graph of a random vector is the undirected graph in which absence of an edge encodes full conditional independence given all remaining variables. The full conditional independence structure can be recovered from low-order conditional independence tests; the maximum order required is characterised in terms of minimal separators in the graph.
arXiv:0705.1613 — Published version (DOI)
HAL (Hyper Articles en Ligne)
Swallowing sound recognition at home using GMM
Authors: Hajer Khlaifi, Dan Istrate, Jacques Demongeot, Jérôme Boudy, Dhafer Malouche
Year: 2018 — HAL:hal-01692422 (JETSAN 2017, Bourges, France)
Status: Extended journal version published in IRBM 39(6), 407–412 (2018).
Abstract: A non-invasive acoustic method is developed for distinguishing swallowing sounds from ambient noise during food intake, in the context of the e-swallhome project for post-stroke dysphagia monitoring. Gaussian Mixture Models trained with the EM algorithm and leave-one-out cross-validation achieve 100% recognition accuracy on the study dataset.
HAL:hal-01692422 — Published version (DOI)
A survey on multi-agent management approaches in the context of intelligent energy systems
Authors: Khawla Ghribi, Sylvie Sevestre, Zahia Guessoum, Javier Gil-Quijano, Dhafer Malouche, Anis Youssef
Year: 2014 — HAL:cea-01888018 (CISTEM 2014, Tunis, Tunisia)
Status: Published in 2014 IEEE International Conference on Electrical Sciences and Technologies in Maghreb (CISTEM).
Abstract: A taxonomy of multi-agent approaches to managing complex energy systems is proposed, distinguishing reactive (short-term) from anticipative (long-term) management and classifying systems by the level (component, sub-system, system) at which decisions are made.
HAL:cea-01888018 — Published version (DOI)
Gaussian Faithful Markov Trees
Authors: Dhafer Malouche, Bala Rajaratnam
Year: 2010 — HAL:inria-00494743 (42èmes Journées de Statistique, SFdS, Marseille)
Abstract: Conference-length presentation of work on covariance graphs that faithfully represent Gaussian marginal independencies when the graph is a tree. Companion to arXiv:0912.2407 and the Journal of Probability and Statistics (2011) paper.
Modèle graphique ou champ Markovien Gaussien en image: estimation du graphe de voisinage
Authors: Rania Bengrich, Dhafer Malouche, Sylvie Sevestre-Ghalila
Year: 2009 — HAL:inria-00386779 (41èmes Journées de Statistique, SFdS, Bordeaux)
Abstract: Graphical-model estimation is coupled with Gaussian Markov random-field modelling for image textures, in order to estimate the neighbourhood graph of a stationary periodic Markov field. The method exploits texture periodicity to recover the underlying spatial-interaction graph.
Classification cas ostéoporotique – témoin par Modélisation Graphique
Authors: Makrem Djebali, Dhafer Malouche, Sylvie Sevestre-Ghalila
Year: 2009 — HAL:inria-00386781 (41èmes Journées de Statistique, SFdS, Bordeaux)
Abstract: Graphical-model variable selection is used to predict osteoporosis status from a clinical dataset with potentially missing observations at prediction time. The selected concentration graph is fitted on complete data, then specialised for prediction patients with missing covariates by re-estimating the model on the available subset of variables.
SSRN
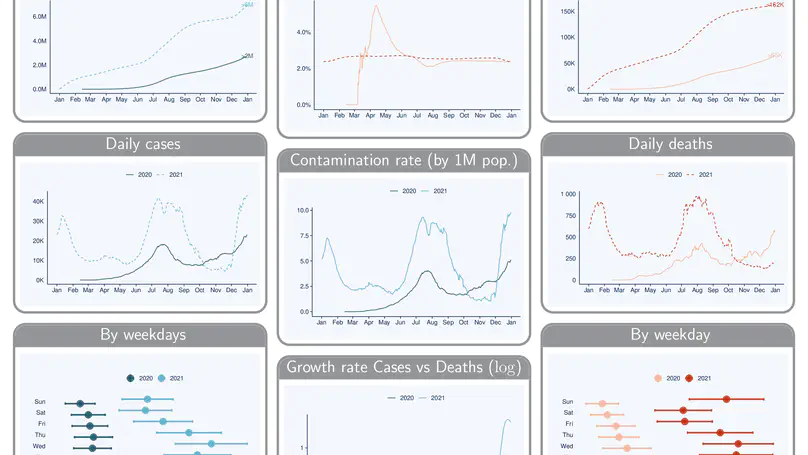
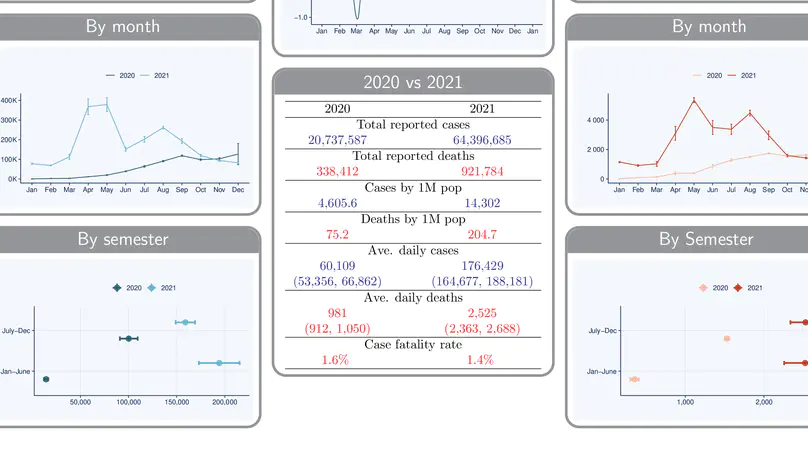
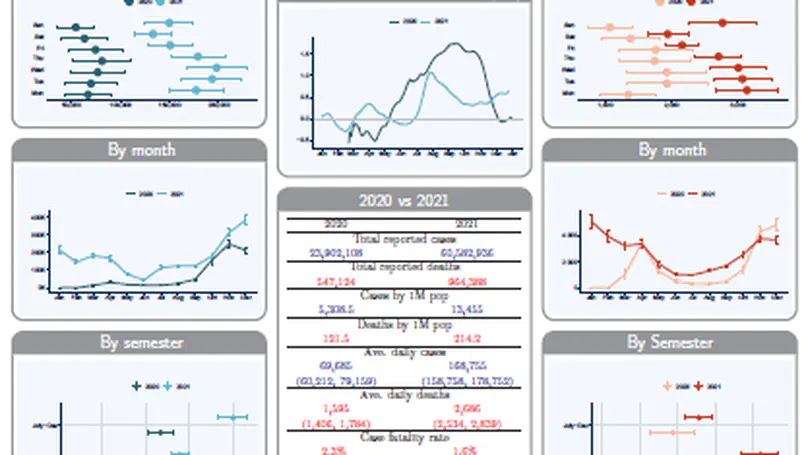
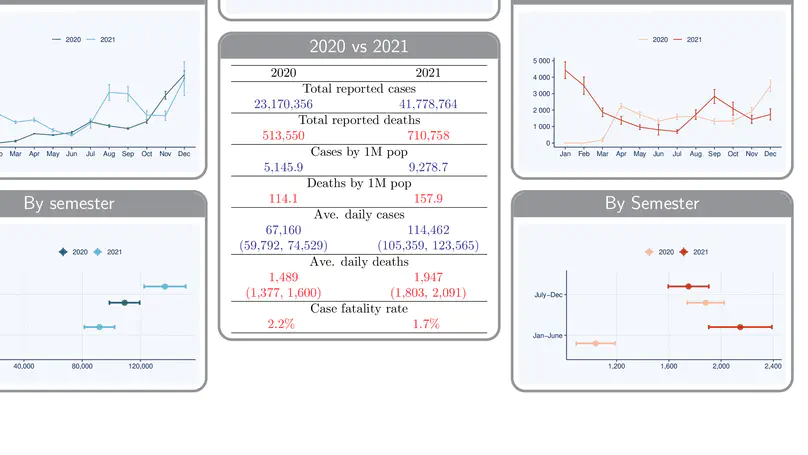
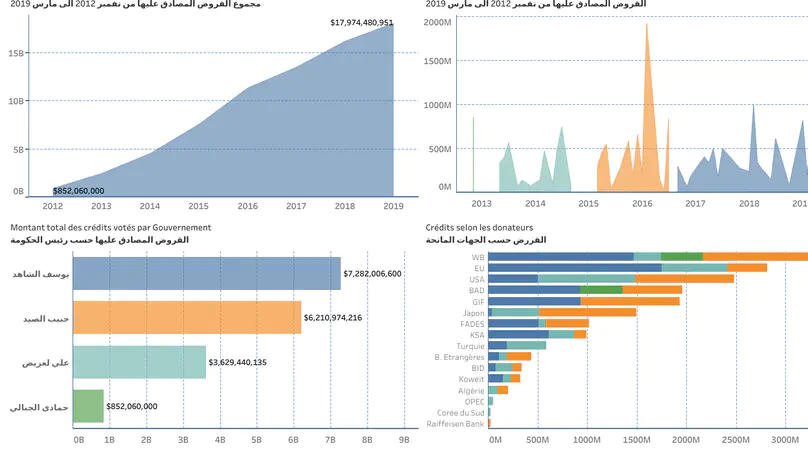
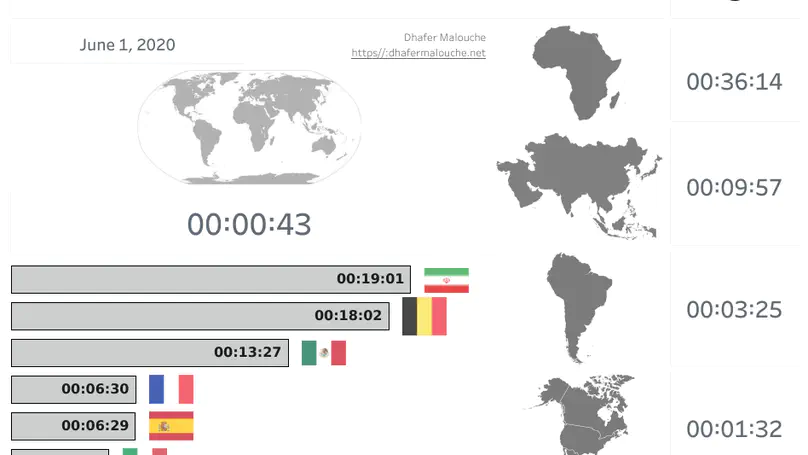
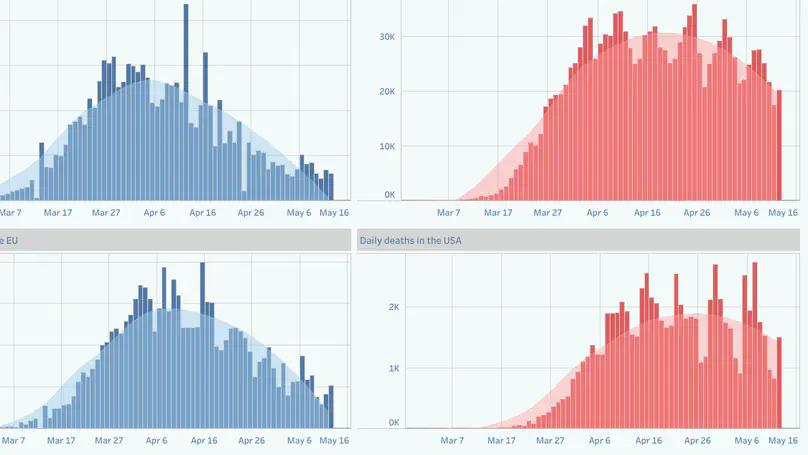
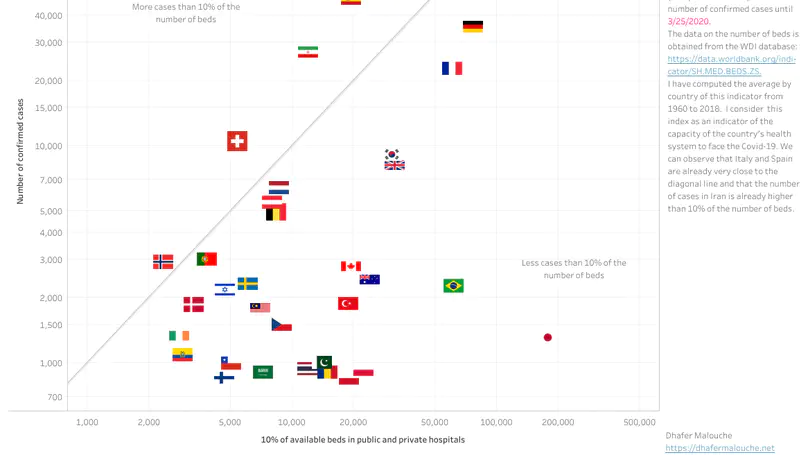
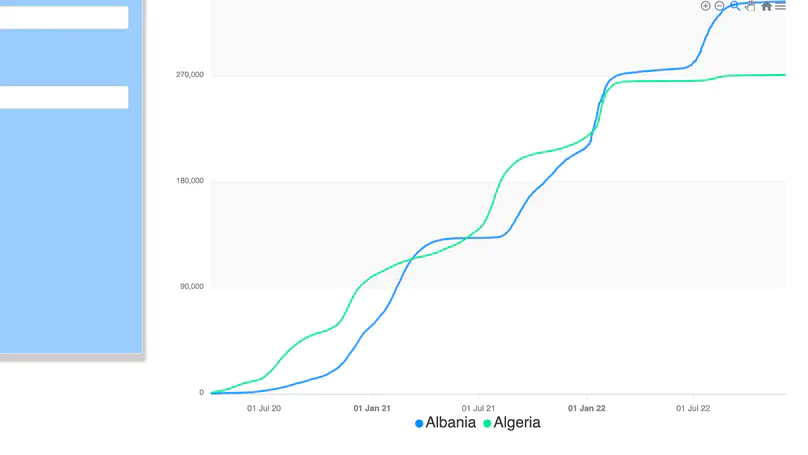
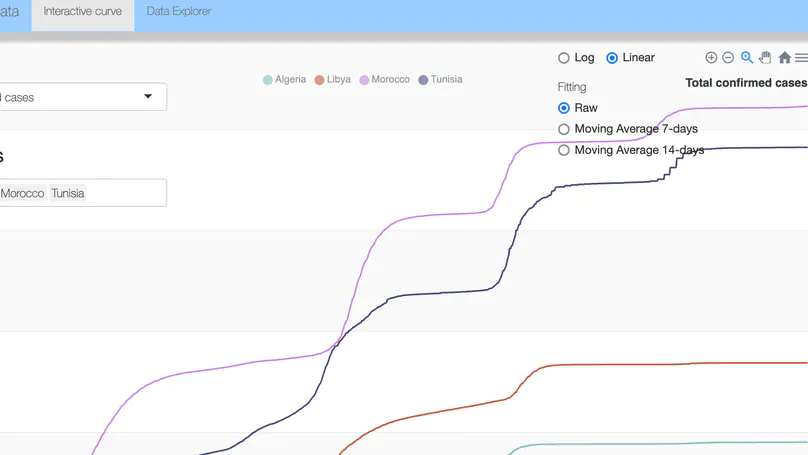
Covidradar24.org, a Real-Time COVID-19 Tracker
Authors: Dhafer Malouche
Year: 2021 — SSRN:3900615
Abstract: Covidradar24.org is a platform aggregating more than 280 real-time dashboards on COVID-19 morbidity and mortality covering countries, continents and territories. The paper documents the data sources, refresh pipeline and visual-analytic design choices, alongside the reproducible R/Shiny and R Markdown infrastructure used to maintain the dashboards.
Estimating Excess Mortality Associated with COVID-19 Pandemic: A 151 Cross-Countries Study
Authors: Dhafer Malouche, Habiba Ben Romdhane
Year: 2020 — SSRN:3731481
Abstract: World Bank population and mortality data are combined with the IHME (University of Washington, Seattle) COVID-19 SEIR projections of pandemic deaths for 151 countries to estimate, country by country, the excess crude death rate associated with COVID-19 by 31 December 2020 under each IHME non-pharmaceutical-intervention scenario. Projected new death crude rates, growth rates, and the share of COVID-19 in total annual deaths are reported.